Description
Instruct thinBASIC Core Engine to measure execution time and count of script functions.
At the end of script execution a trace file will be created in the same directory of the executed script.
Syntax
#PROFILE {ON | OFF} [, SaveFile]
Returns
None
Parameters
Remarks
If #PROFILE is ON, every time a script function is encountered thinBasic Core Engine will:
1.increment an internal counter (one for each script function) counting the number of times the function has been executed
2.keep track of time spent during execution
If optional parameter SaveFile is %TRUE, at the end of script execution a .CSV file will be created in the same directory of the script. Trace file will be named with the same name of the script file followed by ".Profile_YYYYMMDD_HHMMSS.CSV" where YYYYMMDD_HHMMSS will be the current date and time. Example:
•if script file name is: "MyScript.tbasic"
•trace file will be: "MyScript.tbasic.Profile_YYYYMMDD_HHMMSS.CSV"
.CSV file has 9 columns separated by ;
1.Function: function name
2.Calls: number of times a function as been executed
3.Run (ms): function execution time in ms
4.Stack (ms): function stack allocation time in ms
5.UnStack (ms): function stack de-allocation time in ms
6.Total (ms): total function execution time considering Run, Stack, UnStack time
7.Mean (ms): total execution time (column 6) divided by number of function executions (column 2)
8.# params: number of parameters
9.# local vars: number of local variables including parameters
If a script is executed with #PROFILE ON inside thinAir, a profiler window will be opened listing last execution data:
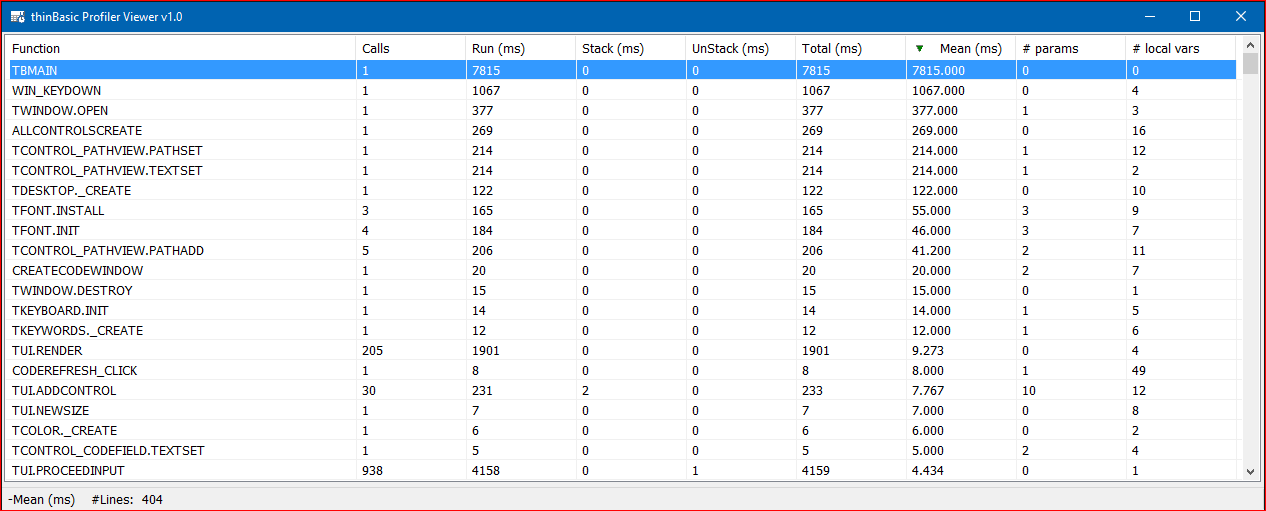
Each column can be sorted ascending/descending clicking on column header.
Restrictions
Attention:
1.execution time will only measure the time spent executing code inside the function
2.execution time will not contemplate time spent passing parameters to function
3.execution time will not contain time spent in allocating and de-allocating function local stack
4.if function1 will call function2 and function2 will call function3:
•function1 timing will measure the total time to call function2 and function3
•function2 timing will measure the total time to call function3
This functionality is available at the following conditions: https://msdn.microsoft.com/en-us/library/windows/desktop/dn553408(v=vs.85).aspx
See also
Examples
#PROFILE ON, %TRUE